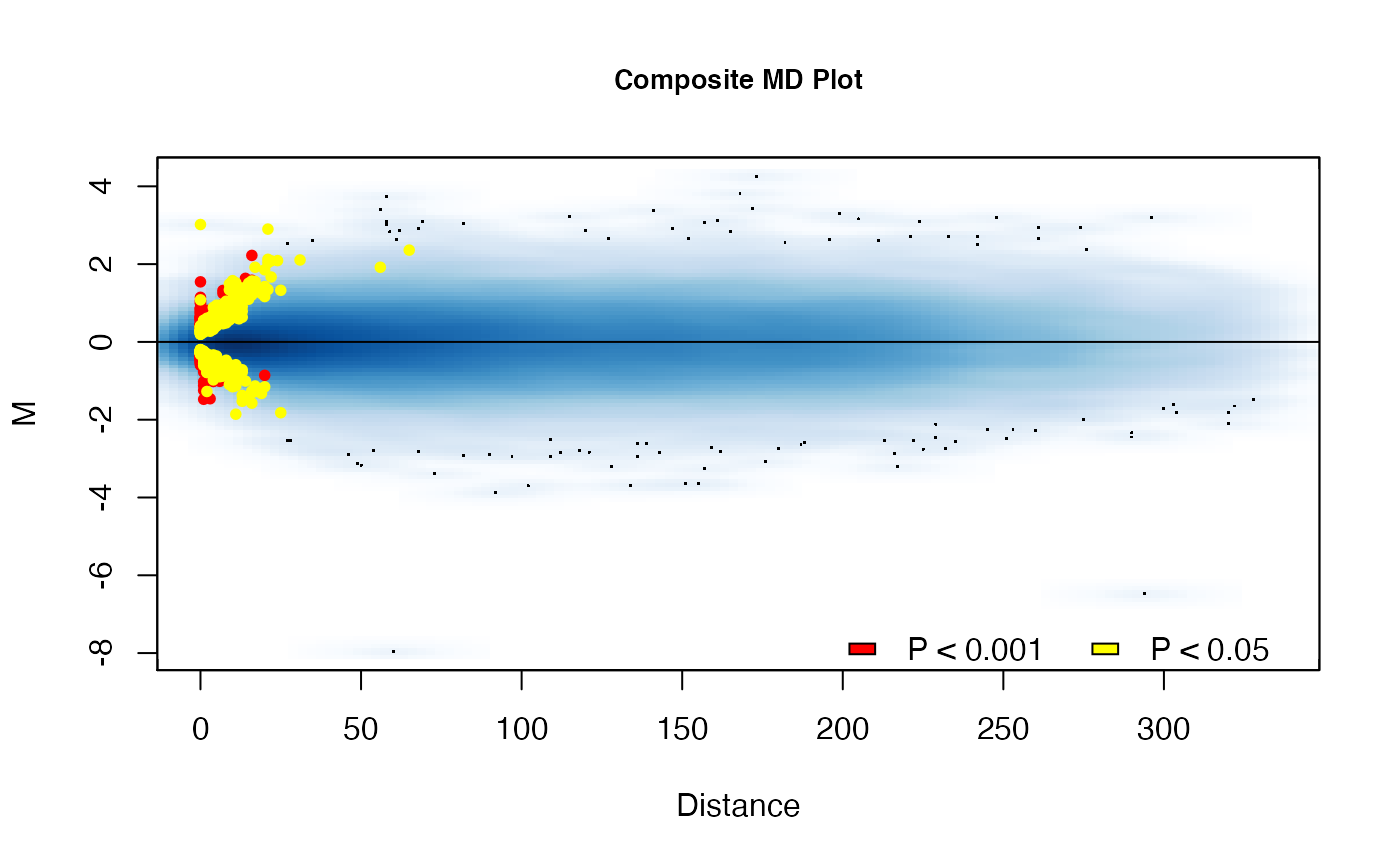
Plot a composite MD plot with the results of a comparison
Source:R/plot_functions.R
MD_composite.RdPlot a composite MD plot with the results of a comparison
MD_composite(hicexp, plot.chr = NA, D.range = 1)
Arguments
| hicexp | A hicexp object which has had a multiHiCcompare comparison step performed on it. |
|---|---|
| plot.chr | A specific chromosome or set of chromosome which you want to plot. This should be a numeric value, i.e. to plot chromosome 1 set plot.chr = 1, to plot chromosomes 1 and 5 set plot.chr = c(1, 5). Defaults to NA indicating that all chromosomes present in the hicexp will be plotted. |
| D.range | Allows for subsetting of the plot by Distance. Set to proportion of total distance that you want to be displayed. Value of 1 indicates that the entire distance range will be displayed. Defaults to 1. |
Value
An MD plot
