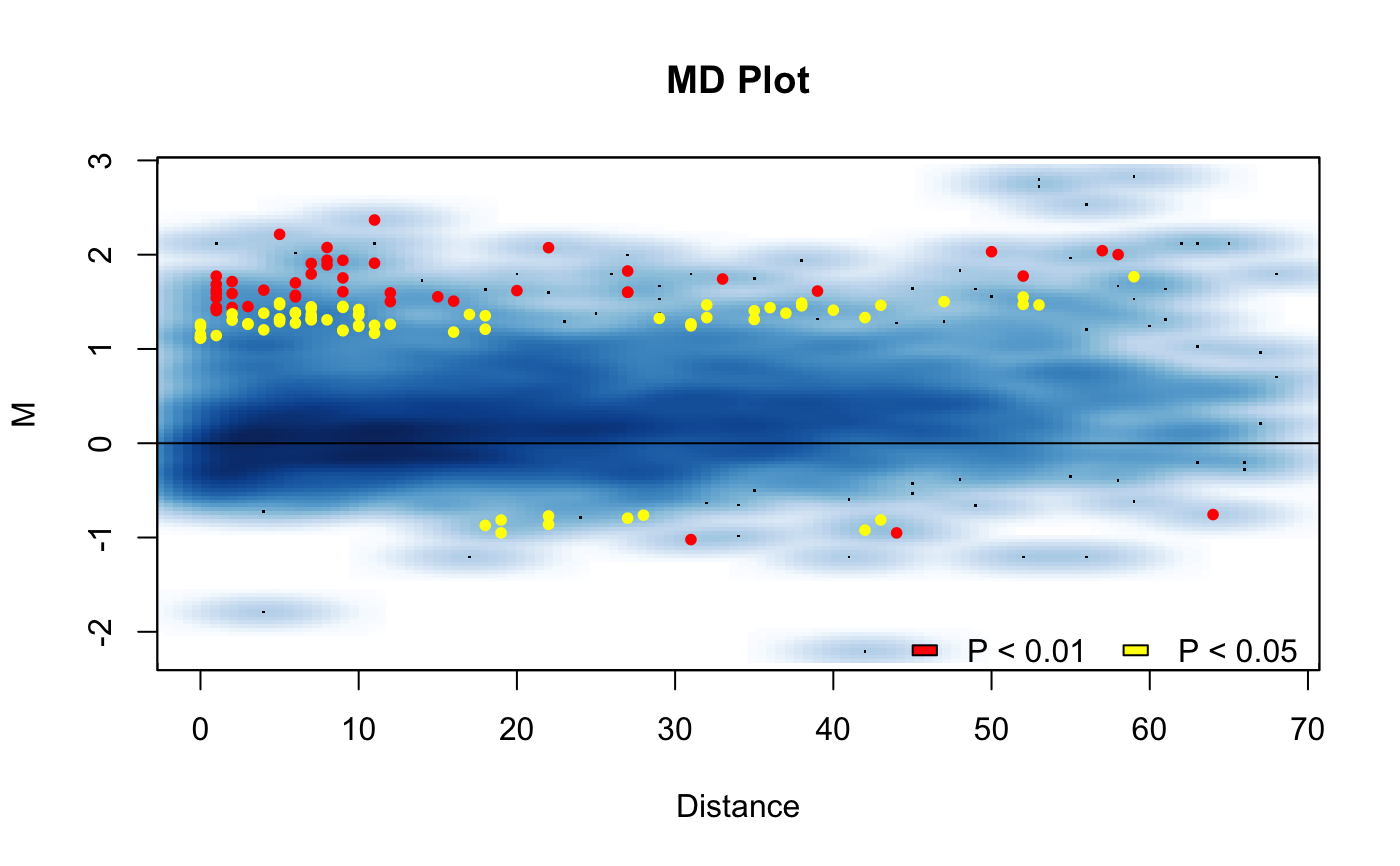
Visualize the MD plot.
MD.plot2(M, D, p.val = NA, diff.thresh = NA, smooth = TRUE)
Arguments
| M | The M component of the MD plot. Available from the hic.table object. |
|---|---|
| D | The D component of the MD plot. The unit distance of the interaction. Available from the hic.table object. |
| p.val | An optional p-value vector to provide color to the plot based on the significance of the differences between the IFs. |
| diff.thresh | A difference threshold used for calculating p-values. If set to a value will add dotted horizontal lines to the plot to display the threshold cutoffs. See `hic_loess` or `hic_diff` functions help for more information on this parameter. |
| smooth | Should smooth scatter plots be used? If set to FALSE ggplot scatter plots will be used. When option is TRUE, plots generate quicker. It is recommend to use the smooth scatter plots. |
Value
An MD plot.
Examples
data('HMEC.chr22') data('NHEK.chr22') hic.table <- create.hic.table(HMEC.chr22, NHEK.chr22, chr='chr22') # Plug hic.table into hic_loess() result <- hic_loess(hic.table)#>#>#>#>