Detect differences between two jointly normalized Hi-C datasets.
Source:R/hic_compare.R
hic_compare.RdDetect differences between two jointly normalized Hi-C datasets.
hic_compare(
  hic.table,
  A.min = NA,
  adjust.dist = TRUE,
  p.method = "fdr",
  Plot = FALSE,
  Plot.smooth = TRUE,
  parallel = FALSE,
  BP_param = bpparam()
)
Arguments
| hic.table | A hic.table or list of hic.tables output from the
|
|---|---|
| A.min | The required value of A in order for a differences to be considered. All Z-scores where the corresponding A value is < A.min will be set to 0. Defaults to NA. If NA, then the 10th percentile of A will automatically be calculated and set as the A.min value. To better determine how to set A.min see the help for ?filter_params(). |
| adjust.dist | Logical, should the p-value adjustment be performed on a per distance basis. i.e. The p-values at distance 1 will be grouped and the p-value adjustment will be applied. This process is repeated for each distance. The highest 15 if you matrix has a maximum distance of 100, then distances 85-100 will be pooled together for p-value adjustment. |
| p.method | The method for p-value adjustment. See ?p.adjust() help for options and more information. Defaults to "fdr". Can be set to "none" for no p-value adjustments. |
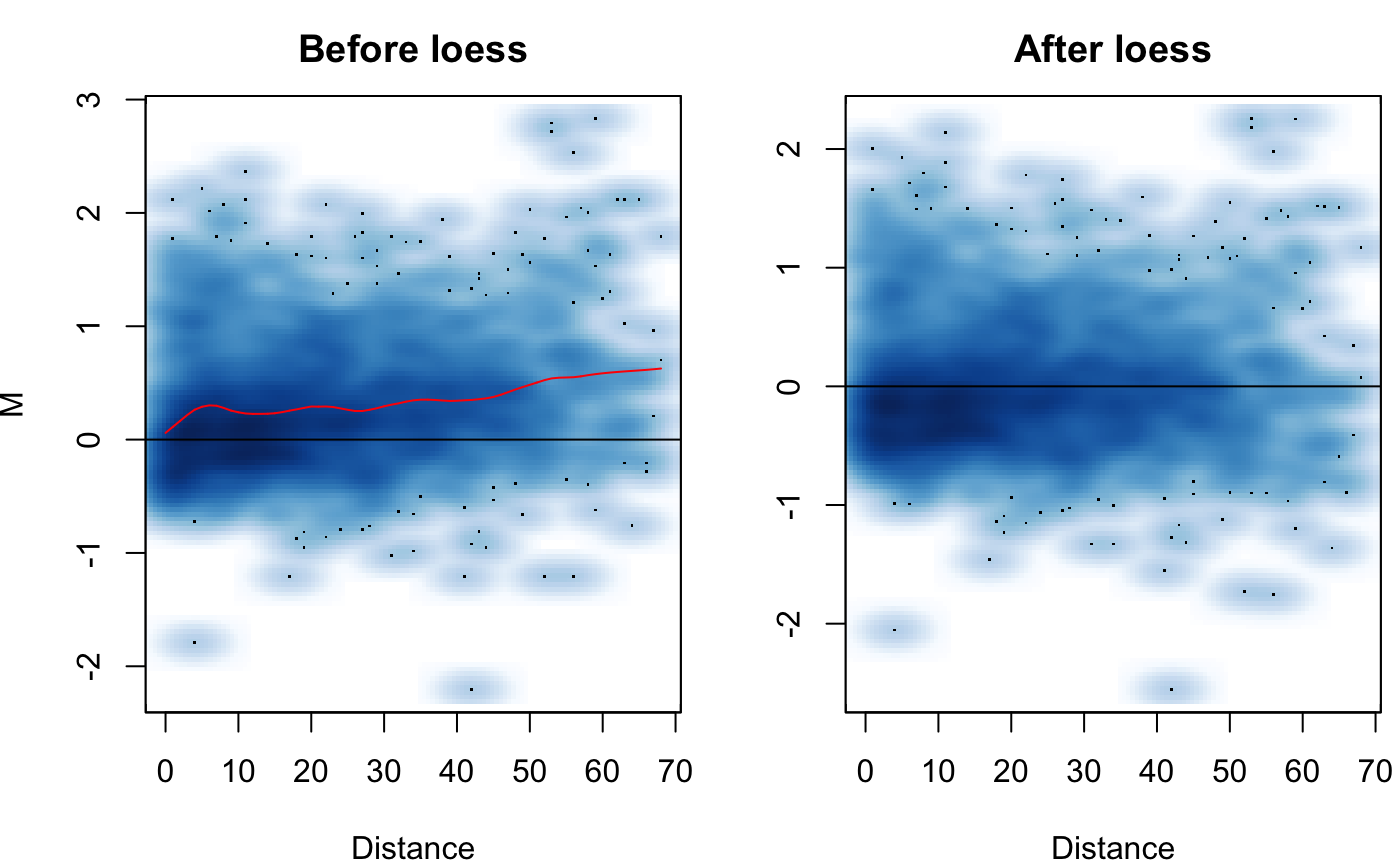
| Plot | Logical, should the MD plot showing before/after loess normalization be output? |
| Plot.smooth | Logical, defaults to TRUE indicating the MD plot will be a smooth scatter plot. Set to FALSE for a scatter plot with discrete points. |
| parallel | Logical, set to TRUE to utilize the |
| BP_param | Parameters for BiocParallel. Defaults to bpparam(), see help for BiocParallel for more information http://bioconductor.org/packages/release/bioc/vignettes/BiocParallel/inst/doc/Introduction_To_BiocParallel.pdf |
Value
A hic.table with additional columns containing a p-value for the significance of the difference and the raw fold change between the IFs of the two datasets.
Details
The function takes in a hic.table or a list of hic.table objects created
with the hic_loess function. If you wish to perform difference
detection on Hi-C data for multiple chromosomes use a list of hic.tables. The process
can be parallelized using the parallel
setting. The adjusted IF and adjusted M calculated from hic_loess are used for
difference detection. Difference detection is performed by converting adjusted M
values to Z-scores. Any M value with a corresponding average expression level (A;
mean of IF1 and IF2)
less than the specified A.quantile is not considered for Z-score calculation.
This throws out the
untrustworthy interactions that tend to produce false positives.
The Z-scores are assumed to follow a roughly standard normal
distribution and p-values are obtained. P-value adjustment for multiple testing
is then performed on a per distance basis (or on all p-values, optionally).
i.e. at each distance the vector of p-values corresponding to the
interactions occuring at that distance have the selected multiple testing correction
applied to them. See methods of Stansfield & Dozmorov 2017 for more details.
Examples
# Create hic.table object using included Hi-C data in sparse upper triangular # matrix format data('HMEC.chr22') data('NHEK.chr22') hic.table <- create.hic.table(HMEC.chr22, NHEK.chr22, chr = 'chr22') # Plug hic.table into hic_loess() result <- hic_loess(hic.table, Plot = TRUE)#>#>#>#>